Holy cow did I learn a lot on this one. It took me the better part of two weeks to put it all together/learn everything required. This was actually my first go at automating Windows and I learned a LOT.
The idea behind this setup is that if a user can’t access a TCP based service or can’t browse to a web page, they can pop into ServiceNow (which I’ll call SNOW moving forward) and create a service order for it, which will then call Tower to perform some automated troubleshooting.
Demo Video
Windows Machines
First things first, all windows devices that we will be connecting to need WinRM enabled. This is the Windows Remote Management system that allows me to connect in and run commands. The easiest way to go about it is to create a group policy and have the windows machines automatically enable it.
If you are just looking to throw it on a machine real quick like without group policy, you can do the following.
Run this powershell script:
# powershell to turn on winrm
[Net.ServicePointManager]::SecurityProtocol = [Net.SecurityProtocolType]::Tls12
$url = "https://raw.githubusercontent.com/ansible/ansible/devel/examples/scripts/ConfigureRemotingForAnsible.ps1"
$file = "$env:temp\ConfigureRemotingForAnsible.ps1"

(New-Object -TypeName System.Net.WebClient).DownloadFile($url, $file)

powershell.exe -ExecutionPolicy ByPass -File $file
Run these commands via powershell to allow CredSSP delegation and enable the server:
# turn on client delegation
Enable-WSManCredSSP -Role client -DelegateComputer *

# turn on server options for CredSSP
Enable-WSManCredSSP -Role server
In my example I’m performing something known as double-hopping.
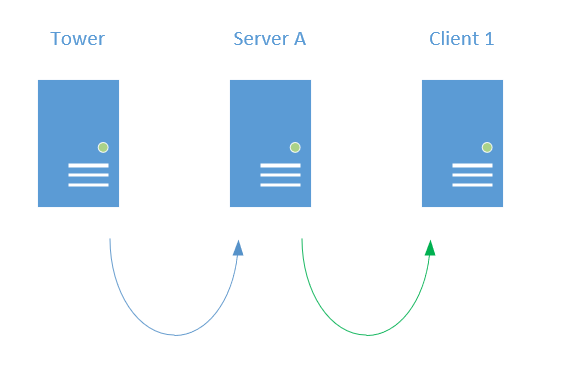
What I’m doing is having Tower reach out to Server A only. I will do testing from Server A, but I’ll also tell Server A to connect to Client 1 and perform some tests. This hop from Server A to Client 1 is considered a “double hop”. Windows prevents this behavior by default for security reasions, but there are some work arounds as seen here. The work around I used is CredSSP. This is easy to use by setting this host variable for these machines:
ansible_winrm_transport=credsspThis is what the host variables look like for each of these first hop devices I’ll be controlling:
---
ansible_winrm_transport: credssp
ansible_host: 10.1.1.10
ansible_connection: winrm
ansible_winrm_scheme: http
ansible_port: 5985
Notice also that in the above I’m specifying the scheme as http and the port as 5985. HTTP indicates I’m not performing encryption, which you would want to do in production(this is just a lab setup). When performing the connection unencrypted I also need to specify the port as 5985(when encrypted the port would be 5986 and is the default).
If you run into any issues when using WinRM with Ansible to connect to your clients check this quick guide.
I wanted it to be easy for someone to find their computer name, and a simple solution is to add a toolbar that has their machine name(either bginfo or what I did here:
Right-click on Taskbar ->
Go to Toolbars ->
Choose New Toolbar,
type in \\%computername%,  and Click Select Folder.
ServiceNow Configuration
I won’t cover the full setup since Michael Ford has already done that for us. That link is a walk through that will get you to the point where SNOW makes API calls to Tower to fire off job templates(while passing over variables).
Since I’m standing on the shoulders of giants, I’ll skip right to my service catalog item:
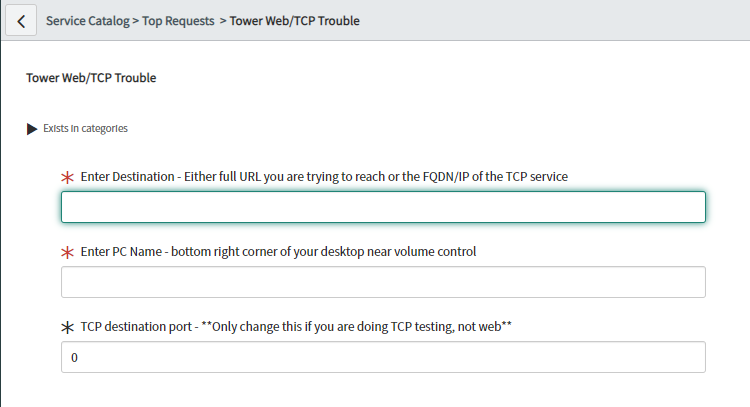
As you can see I kept it simple. I am by no means a SNOW developer, which you will quickly see once I jump into the processing section LOL.
I’m gathering the destination, so https://gregsowell.com or if it’s some random TCP service it could just be gregsowell.com or 1.2.3.4.
I’m also getting their machine name from their taskbar.
Last if it is a standard TCP service they put the port number there, otherwise it stays as 0.
In Tower I did have to pull some entries from the SNOW request table, but not knowing anything about the structure of the tables…or even what the tables were I was a little lost. I ended up finding the SNOW “REST API Explorer”. This gives you the ability to find the tables, and explore their structure along with creating cURL API calls based on what you build.
Once in the rest explorer you can choose table name, add additional query parameters(like ordering by newest entry), and picking individual fields you are interested.
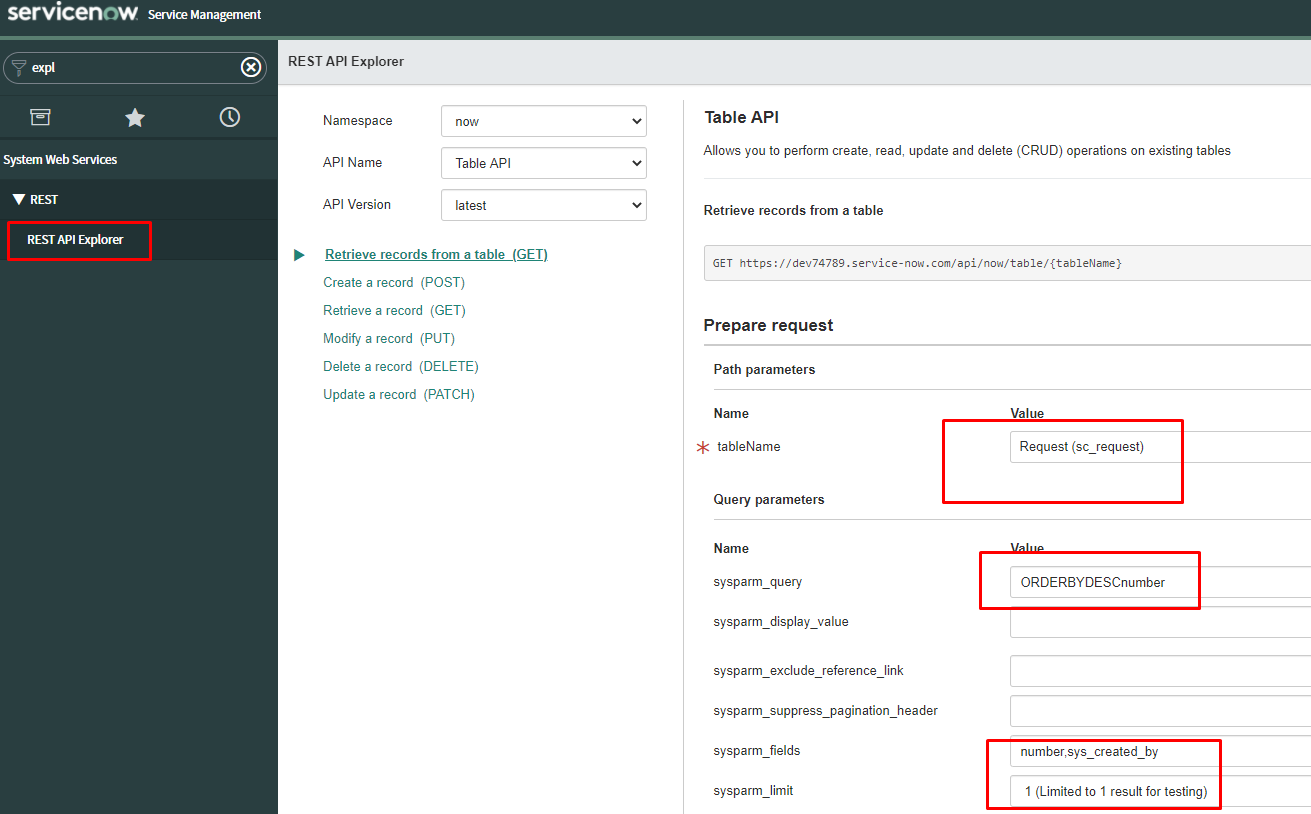
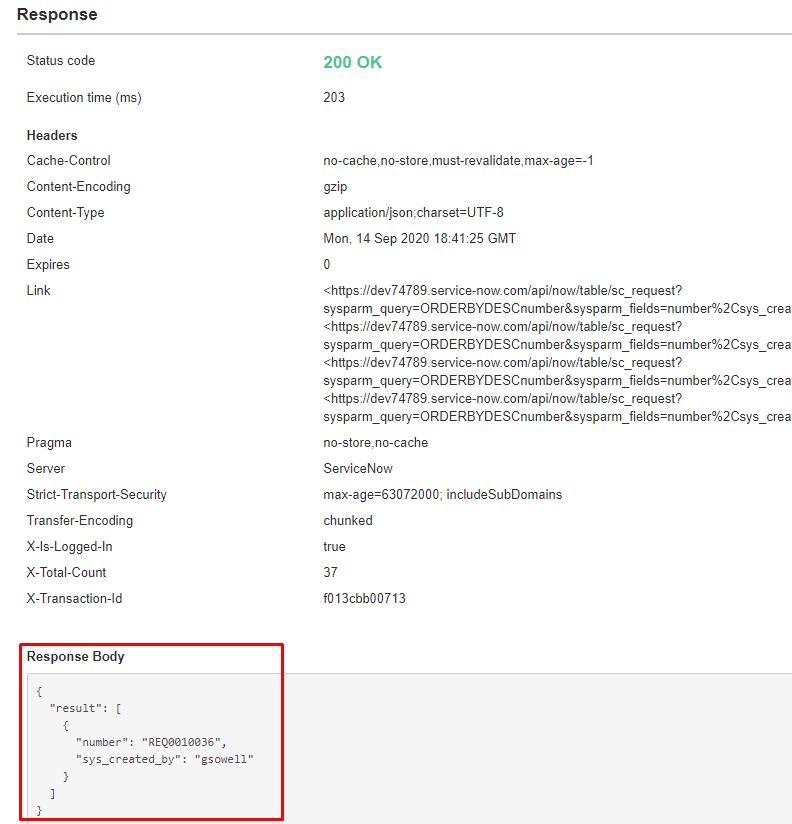
I like the output to come back as json, that way I can convert it to yaml with some ansible filters.
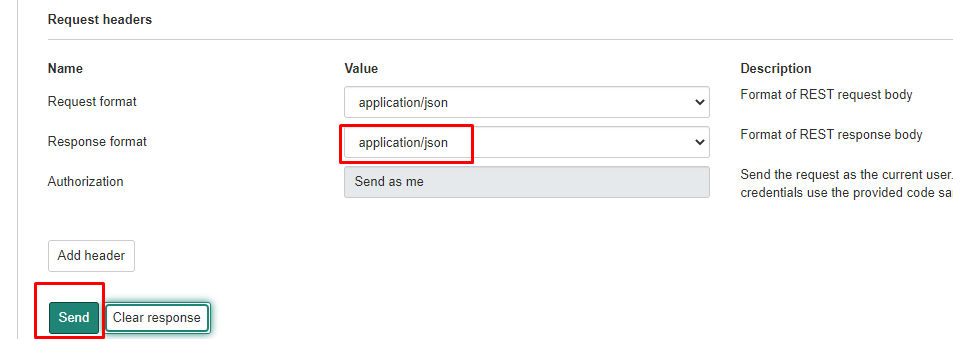
Once you click send it gives you your desired output right in the browser;
You can also click the output method of choice in “Code Samples” for some copy/paste content:

Tower Configuration
I’ll start with the playbook that will ultimately call my processing role:
I setup my basic variables that are passed from SNOW:
    tcp_port: "{{ variable_3 }}"
    test_url: "{{ variable_2 }}"
    test_client: "{{ variable_1 }}"
tcp_port is always zero for web testing.
test_url is essentially the destination we are trying to reach(for either webpage or TCP based service.
test_client is the hostname of the user’s PC.
I include a single task, which is just calling the role detailed below.
Here is the role I’ve created to perform all of the processing.
I’ll look at the main files required:
Remember when I mentioned I’m not a SNOW dev…keep that in mind.
In the above at the top you see I make a restful call to SNOW and request the last created request from the request table(I pull the req ID and the username). I’m banking on the fact that no other requests came in in the seconds it took for this to fire(not what you would do in production). Obviously I’d build this into my workflow in an actual production environment.
I then call either the web tshooting or TCP tshooting task files depending on what is required.
Once that processing is complete I open a SNOW incident as the requesting user and add my tshooting info and assign it to the correct group.
I use several jinja2 templates that have powershell code to extract IP info as well as to perform the TCP and web testing. Feel free to browse away.
For example, here’s the curltest powershell template.
As you can see it’s simply issuing the curl test and returning status code as well as raw content length(size of content returned by query).
The fun starts to happen in the web tshooting task file.
I’m using the jinja templates to first resolve the client name.
Then I use one of the template files to double hop to the client machine and perform a powershell version of cURL to test pulling the web page. After the client is tested, I test from the local domain controller, then I connect to an external canary server and perform the same test.
If any of my tests fail on the inside I then connect to the local Cisco ASA firewall and perform a packet tracer test. Packet tracer in an ASA will take the source/destination info and generate a virtual packet. It will then pass this virtual packet through the firewall noting each step what happens to the packet and whether it is allowed through or blocked at various steps. In the end it will supply me with an allowed or dropped.
As a side note, here’s what my ASAv hosts file entry looked like while testing(prior to entry into Tower):
asav ansible_host=10.1.12.15 ansible_connection=network_cli ansible_network_os=asa ansible_user=admin ansible_password=lab ansible_become=yes ansible_become_method=enable ansible_become_pass="lab"At the bottom of this task file I then essentially go through various condition checks and when one is met I set what the incident message will be along with which support group it will be assigned to.
Decision Tree Example
1. If all tests pass(internals and canary both get a status 200 and the website retrieved were within 10 bytes of each other), then the user is instructed to please test again as it looks like service may have been restored. This was likely just a quick blip.
2. If the client fails, but everything else passes(including the firewall rules saying the client should have access), then it is assigned to the Service Desk team as it’s likely just a local PC issue.
3. If the client and firewall fails, then sounds like we have a network issue(needs firewall mod), so assign it to the Network team.
And so on.
The TCP test file is much the same, but it uses a slightly different method to test service(all still using powershell, though).
Wrap Up
Conceptually nothing is too crazy here, but all of the individual pieces can take some time, especially when they are new to you, as much of it was for me here. I hope this post has you thinking about various time sinks within your current workflow that could possible be automated with just a little creativity. What do most of your trouble tickets deal with, and how can you automate their troubleshooting? Let me know how you would implement something like this in your environment.
Thanks and happy automating!
Leave a Reply