

Automated Network Troubleshooting With Ansible Tower And Zabbix

In the role of a network engineer one of the most common tickets/requests we receive is “I can’t reach this thing.” Well that or “the internet is down.” It’s at this point that I ask for the destination IP, then I start the standard pings/traceroutes…but what if I could do all of this before the user ever contacts me? That’s the plan; a device goes down and the monitoring system initiates troubleshooting through Ansible. I actually went further and have it put my support line on DND to supply a blanket message to customers, and create a ServiceNow incident!
Demo Video Of System In Action
I’ve recently been experimenting with Zabbix, which is an opensource monitoring tool(I think it’s made over in Latvia too 🙂 I’ve been looking at it more since there is a plethora of Ansible modules that can make administration of the system much easier. It’s also possible to use the Zabbix servers as your Ansible dynamic inventory(see the .py script and ini file here), which I need to do a little more testing with to get just the way I want.
Configure Zabbix
First things first; configure a Host in Zabbix to be monitored however you like. I did just a simple ICMP ping test to 8.8.8.8 following these instructions. While that tutorial gets you most of the way there, here’s a reminder for myself on some specific configs:
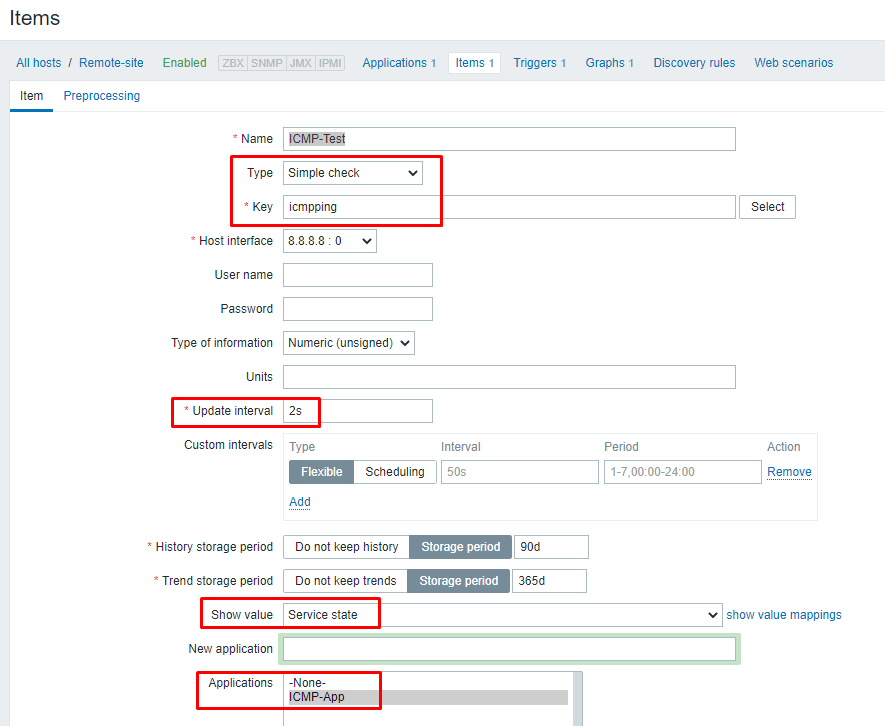
The Key should be exactly “icmpping” without all of the extra options. Then be sure to setup your update interval, change the show value to service state and choose the new application you created.
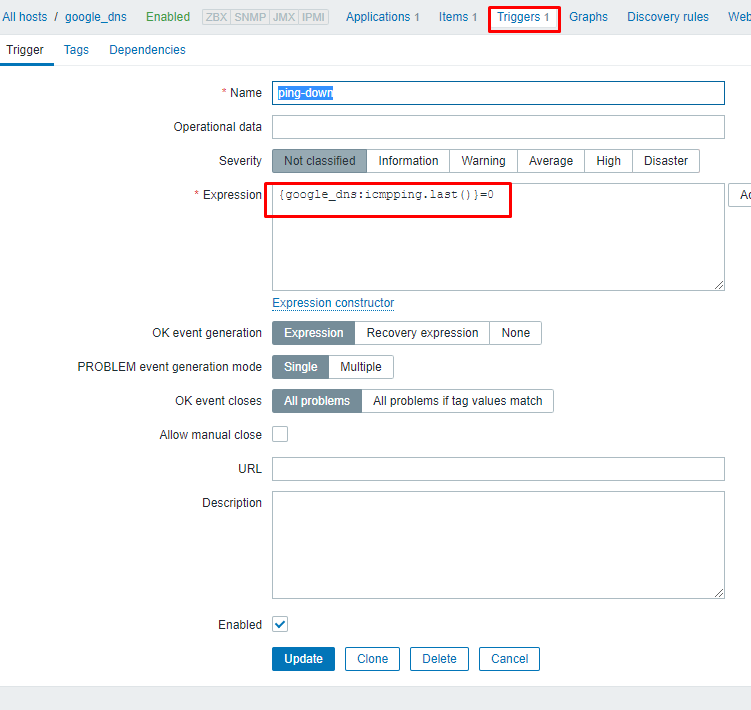
I then create a trigger on this same host using the ping item just created. This trigger is activated when the ping fails to 8.8.8.8:
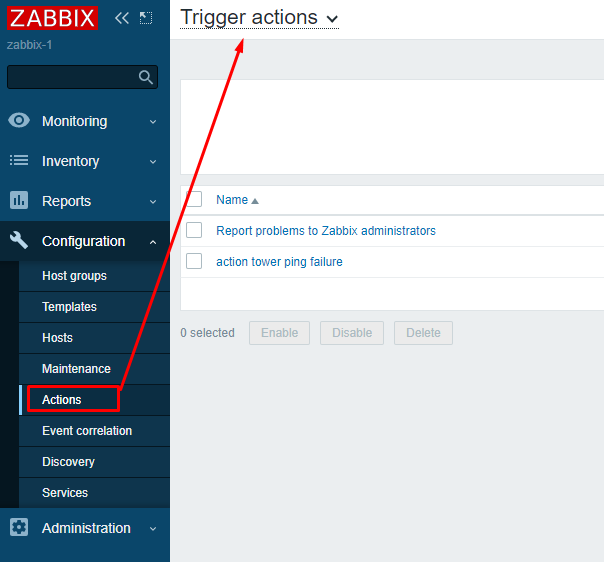
I’ll now create an action that will be fired once the trigger is activated:
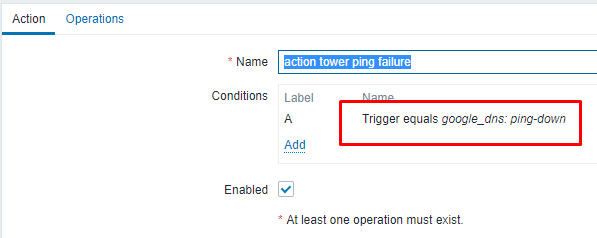
The trigger is set as the ping down trigger I specified above:
Last the operation is set to run a remote command via the zabbix server(*Don’t forget to change “Execute on” to “Zabbix server”*):
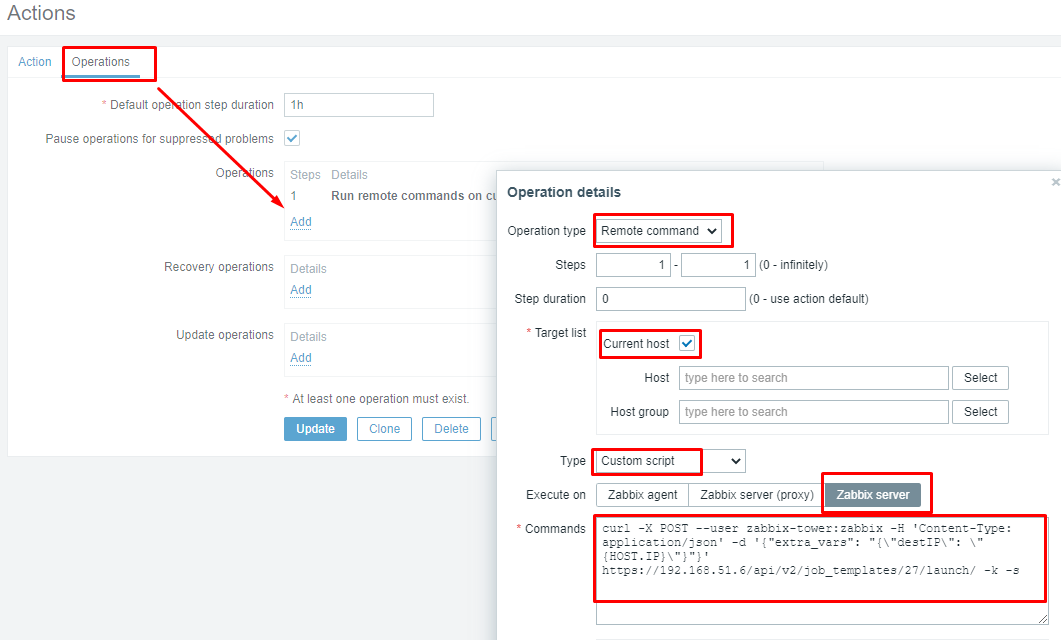
The script being run is this:
1 | curl -X POST --user zabbix-tower:zabbix -H 'Content-Type: application/json' -d '{"extra_vars": "{\"destIP\": \"{HOST.IP}\"}"}' https://192.168.51.6/api/v2/job_templates/27/launch/ -k -s |
The curl command is using user zabbix-tower with password zabbix. It is launching job 27 and passing via extra_vars the variable destIP as the zabbix monitored host IP(in this case 8.8.8.8).
The tower template is this one on my git hub. This playbook connects to a couple of my mikrotik probes and does a ping and traceroute to the supplied destIP from each probe. After it gathers that information it will then email or slack the results to you.
Configure Ansible Tower
One of the brilliant things about Tower is its ability to create custom credentials and pass that info over to playbooks. Here I’ll show how to create custom creds for gmail used in the playbook(I also have custom creds created for slack, but I’ll let you try this one on your own based on my example).
First under admin choose credential type then hit the green plus to add new:

Next fill out the credential type to meet your needs:
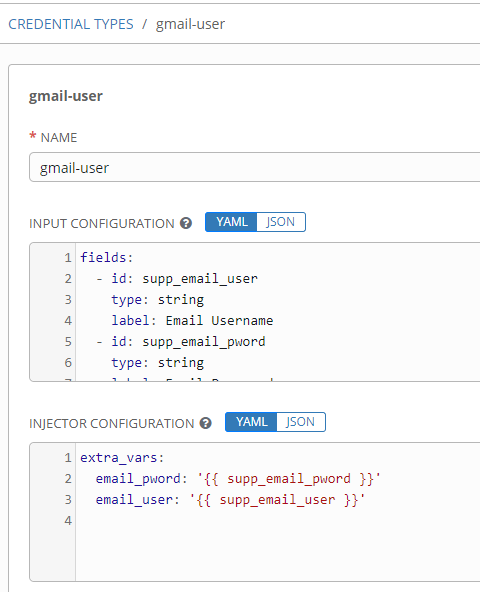
The “input configuration” portion is what you collect from the user. Here’s my configuration in YAML:
1 2 3 4 5 6 7 8 9 10 11 | fields:
- id: supp_email_user
type: string
label: Email Username
- id: supp_email_pword
type: string
label: Email Password
secret: true
required:
- supp_email_user
- supp_email_pword |
In the above notice the following fields:
– id: This is what the variable will be temporarily stored as during collection.
– type: This defines what the input type will be. For username/pass/tokens string is perfect.
– label: This is what is the prompt the user sees when entering information.
– secret: When set to true, this tells Tower to encrypt this value and also hide it in log output. Good for passwords or tokens.
The “required” section indicates these aren’t optional fields.
The “injector configuration” section is how you send this information over to your playbooks:
1 2 3 | extra_vars:
email_pword: '{{ supp_email_pword }}'
email_user: '{{ supp_email_user }}' |
In my case I’ll be sending them as extra_vars. In my playbook the variables “email_pword” and “email_user” are used to set email creds, which is why that’s what is being set via the supplied information.
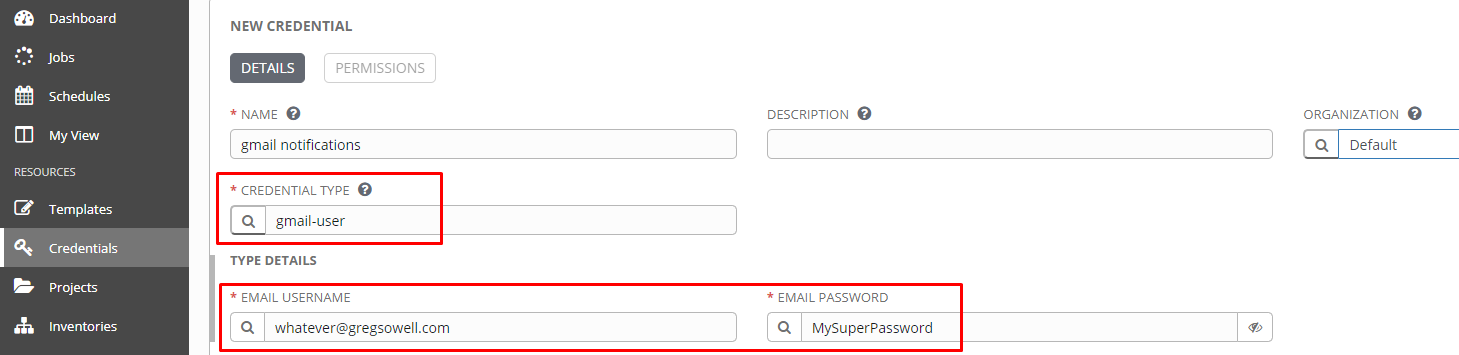
Now that I’ve got the custom credential type created, I’ll add the custom cred:
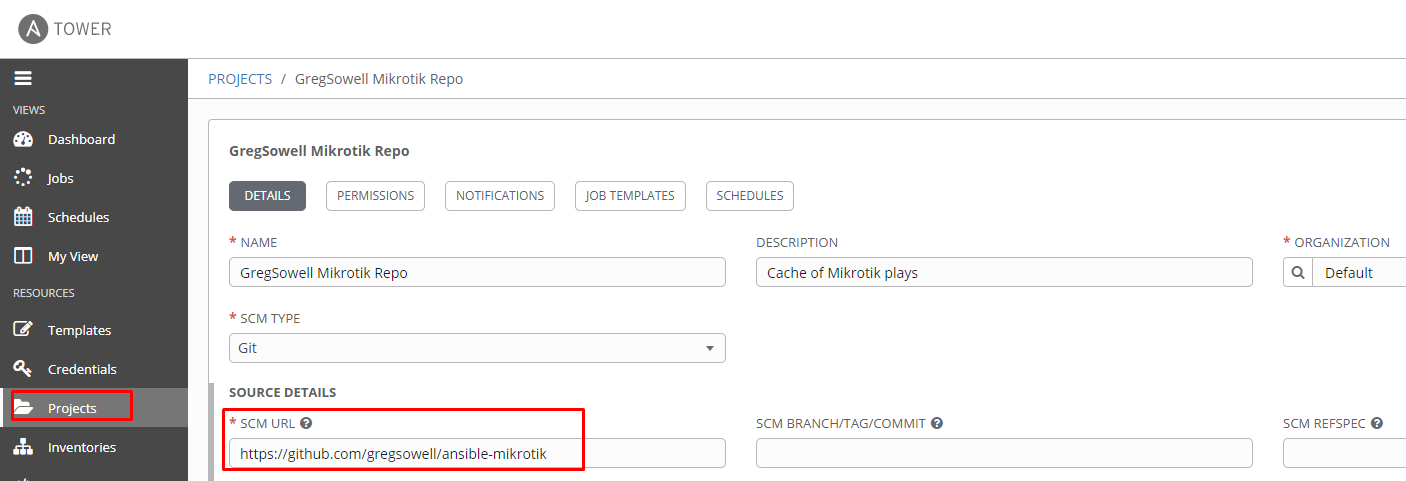
I’m next going to tell Tower to use my git repo:
I’ll then create a job template for my troubleshooting probe playbook:
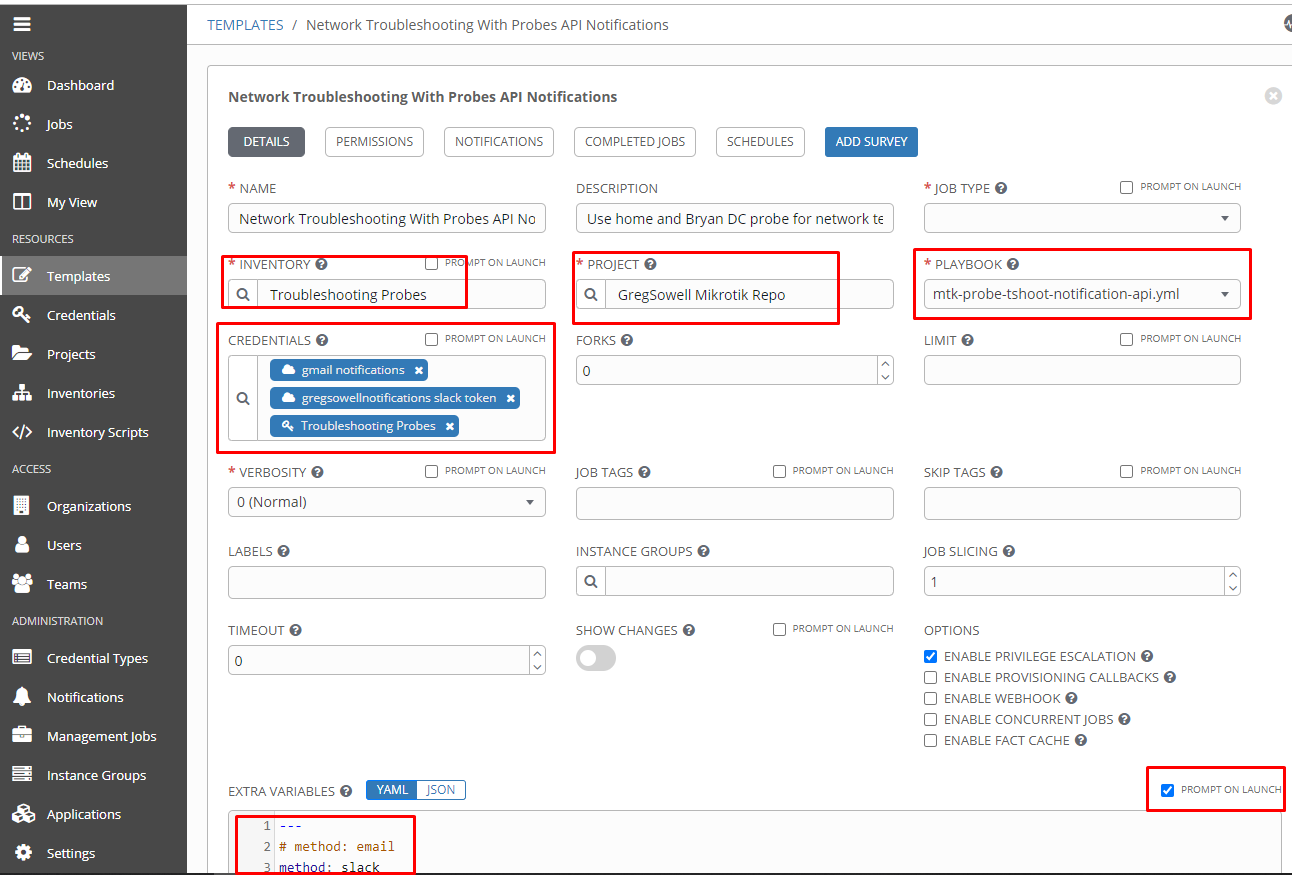
Notice that in extra_vars I supplied it with method of slack. This tells it to use slack rather than email. Also keep in mind that I told extra_vars to “prompt on launch”. This is required for the API call to pass in additional extra_vars.
Also note that I added my credentials for both my slack token as well as my email addresses. These are securely passed to the playbook at runtime!
Extras
In the demo video I put one of my Yealink phones into DND to enable a call handler. It’s all based off of this blog post where I demo using Yealink’s API. I use this playbook on my github to do the work.
What the sequence is up to this point:
1. Zabbix is setup to ping 8.8.8.8.
2. When the ping item returns 0(failed state), the trigger is activated.
3. An action is fired when the trigger is activated.
4. The action calls the Ansible API to run a job passing the IP being monitored.
5. Tower takes the IP supplied and pings/traceroutes to that destination from multiple probes.
6. Tower will then take this aggregated information and send it to you either via slack or email.
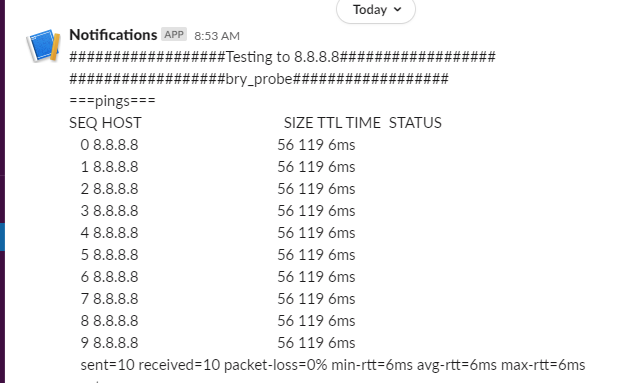
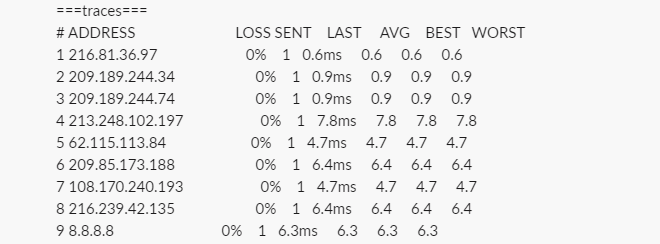
Slack Output
Once the tshooting completes, this is what message is supplied to slack:
I’ve now updated the playbook so that it creates an incident in ServiceNow and adds the tshooting as comments:
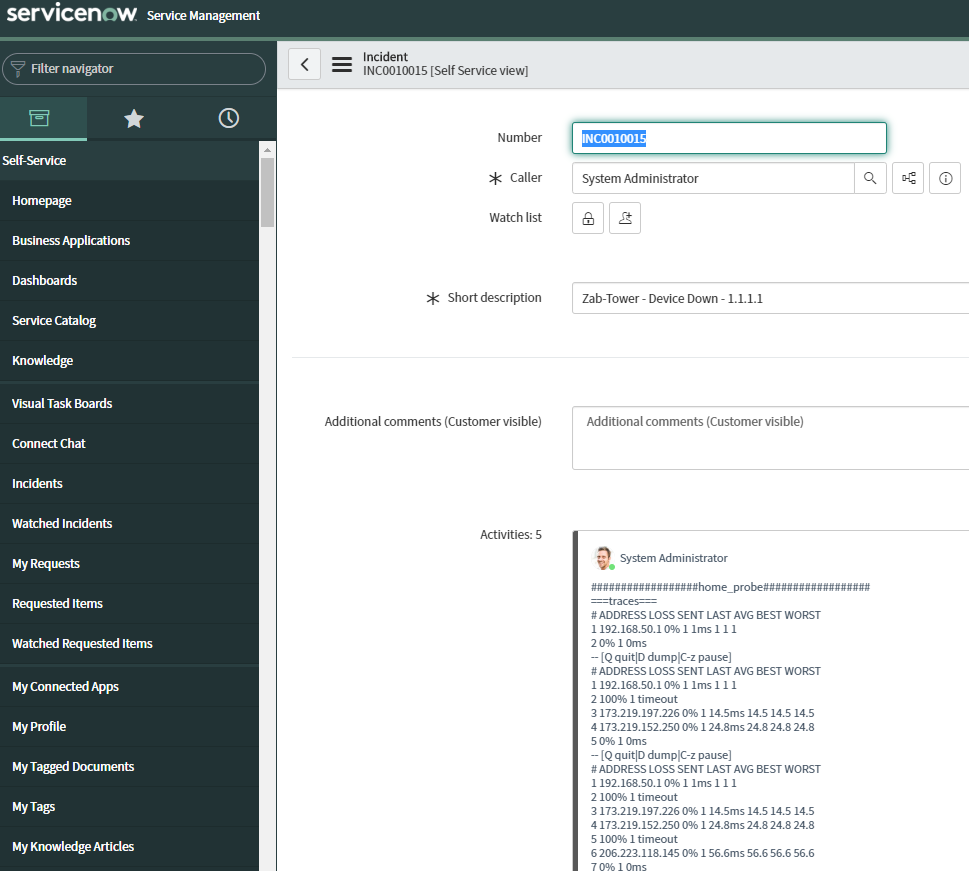
The idea behind all this is that your monitoring system isn’t just telling you there’s an issue, it’s actively performing troubleshooting for you. It can do more than just that; imagine it also takes this information and opens an ticket. Imagine that it also notifies the customer that there’s an issue identified and that you are actively working on it.
By the time the issue notification arrives, there will also be some advanced troubleshooting already performed for you and waiting.
Let me know how you envision using something like this!