Mikrotik Graphing Tool
You guys know I love me some Cacti. I also enjoy the dude. Cacti is especially great for long term retention of graphs. If you don’t have a monitoring tool available, or you are simply in a pinch, then you can use the built in Mikrotik graphing.
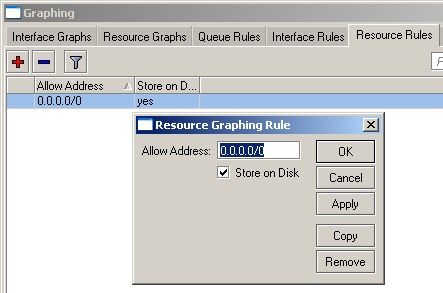
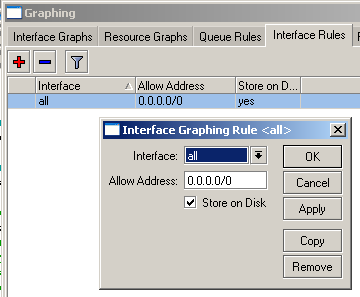
You can enable the graphs by going to tools -> graphing.
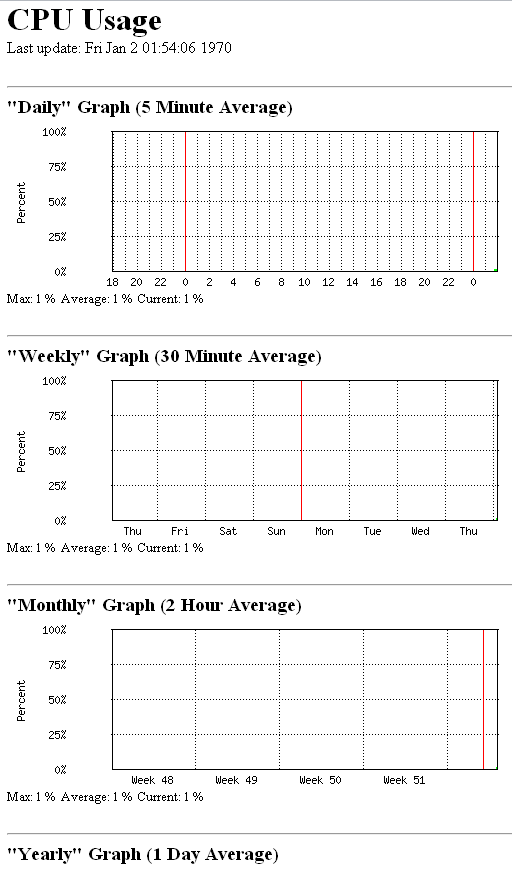
If you want to enable system graphing of CPU/Disk/Memory then go to the Resource Rule tab and add which host or network should have access.

If you would like to enable interface monitoring you can choose either all or individual interfaces. Specify which hosts or networks have access.

You can also graph simple queues following the same methods.
Once you have allowed access, make sure you have your web service running under IP -> services -> www.
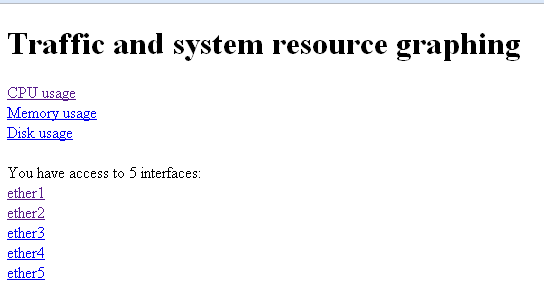
Then navigate to http://Router-IP/graphs/.


I used this in the beginning. I think it works pretty good to start with or “in a pinch” Keep up the good work.